Bokeh处理分类数据
发布时间:2021-12-03
公开文章
实际应用:
from bokeh.io import show, output_file
from bokeh.models import ColumnDataSource
from bokeh.palettes import Spectral6
from bokeh.plotting import figure
from bokeh.transform import factor_cmap
output_file("colormapped_bars.html")
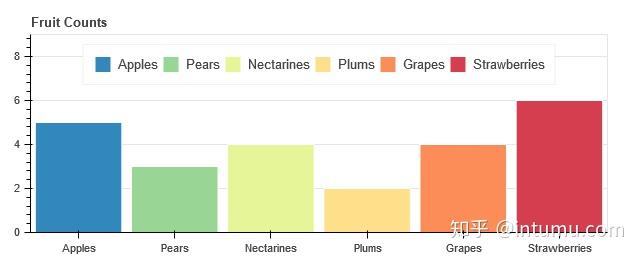
fruits = ['Apples', 'Pears', 'Nectarines', 'Plums', 'Grapes', 'Strawberries']
counts = [5, 3, 4, 2, 4, 6]
source = ColumnDataSource(data=dict(fruits=fruits, counts=counts))
p = figure(x_range=fruits, plot_height=250, toolbar_location=None, title="Fruit Counts")
p.vbar(x='fruits', top='counts', width=0.9, source=source, legend="fruits",
line_color='white', fill_color=factor_cmap('fruits', palette=Spectral6, factors=fruits))
p.xgrid.grid_line_color = None
p.y_range.start = 0
p.y_range.end = 9
p.legend.orientation = "horizontal"
p.legend.location = "top_center"
show(p)
from bokeh.io import show, output_file
from bokeh.models import ColumnDataSource, FactorRange
from bokeh.plotting import figure
output_file("bars.html")
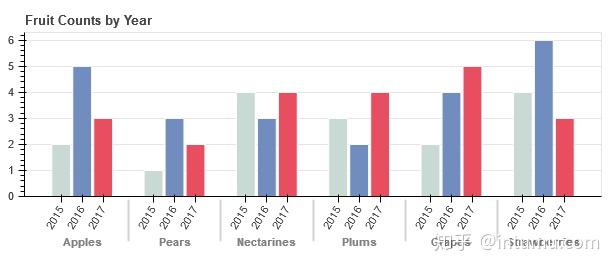
fruits = ['Apples', 'Pears', 'Nectarines', 'Plums', 'Grapes', 'Strawberries']
years = ['2015', '2016', '2017']
data = {'fruits' : fruits,
'2015' : [2, 1, 4, 3, 2, 4],
'2016' : [5, 3, 3, 2, 4, 6],
'2017' : [3, 2, 4, 4, 5, 3]}
# this creates [ ("Apples", "2015"), ("Apples", "2016"), ("Apples", "2017"), ("Pears", "2015), ... ]
x = [ (fruit, year) for fruit in fruits for year in years ]
counts = sum(zip(data['2015'], data['2016'], data['2017']), ()) # like an hstack
source = ColumnDataSource(data=dict(x=x, counts=counts))
p = figure(x_range=FactorRange(*x), plot_height=250, title="Fruit Counts by Year",
toolbar_location=None, tools="")
# 不同分类采用不同颜色
p.vbar(x='x', top='counts', width=0.9, source=source, line_color="white",
# use the palette to colormap based on the the x[1:2] values
fill_color=factor_cmap('x', palette=palette, factors=years, start=1, end=2))
p.y_range.start = 0
p.x_range.range_padding = 0.1
p.xaxis.major_label_orientation = 1
p.xgrid.grid_line_color = None
show(p)
from bokeh.core.properties import value
from bokeh.io import show, output_file
from bokeh.plotting import figure
output_file("stacked.html")
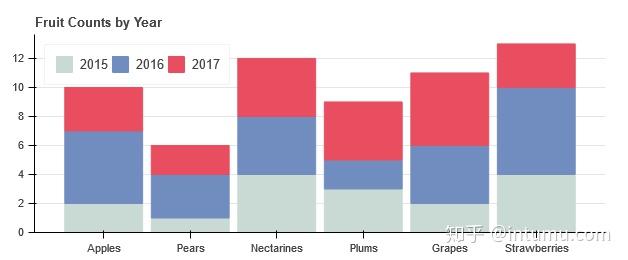
fruits = ['Apples', 'Pears', 'Nectarines', 'Plums', 'Grapes', 'Strawberries']
years = ["2015", "2016", "2017"]
colors = ["#c9d9d3", "#718dbf", "#e84d60"]
data = {'fruits' : fruits,
'2015' : [2, 1, 4, 3, 2, 4],
'2016' : [5, 3, 4, 2, 4, 6],
'2017' : [3, 2, 4, 4, 5, 3]}
p = figure(x_range=fruits, plot_height=250, title="Fruit Counts by Year",
toolbar_location=None, tools="")
p.vbar_stack(years, x='fruits', width=0.9, color=colors, source=data,
legend=[value(x) for x in years])
p.y_range.start = 0
p.x_range.range_padding = 0.1
p.xgrid.grid_line_color = None
p.axis.minor_tick_line_color = None
p.outline_line_color = None
p.legend.location = "top_left"
p.legend.orientation = "horizontal"
show(p)
from bokeh.io import output_file, show
from bokeh.models import ColumnDataSource
from bokeh.palettes import GnBu3, OrRd3
from bokeh.plotting import figure
output_file("stacked_split.html")
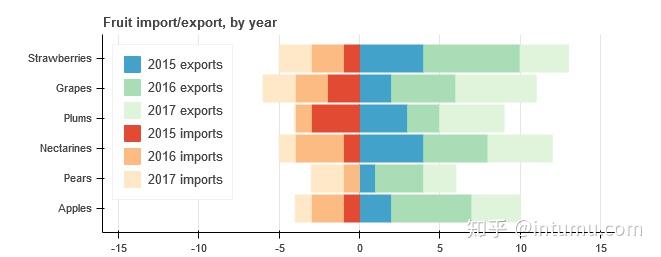
fruits = ['Apples', 'Pears', 'Nectarines', 'Plums', 'Grapes', 'Strawberries']
years = ["2015", "2016", "2017"]
exports = {'fruits' : fruits,
'2015' : [2, 1, 4, 3, 2, 4],
'2016' : [5, 3, 4, 2, 4, 6],
'2017' : [3, 2, 4, 4, 5, 3]}
imports = {'fruits' : fruits,
'2015' : [-1, 0, -1, -3, -2, -1],
'2016' : [-2, -1, -3, -1, -2, -2],
'2017' : [-1, -2, -1, 0, -2, -2]}
p = figure(y_range=fruits, plot_height=250, x_range=(-16, 16), title="Fruit import/export, by year",
toolbar_location=None)
p.hbar_stack(years, y='fruits', height=0.9, color=GnBu3, source=ColumnDataSource(exports),
legend=["%s exports" % x for x in years])
p.hbar_stack(years, y='fruits', height=0.9, color=OrRd3, source=ColumnDataSource(imports),
legend=["%s imports" % x for x in years])
p.y_range.range_padding = 0.1
p.ygrid.grid_line_color = None
p.legend.location = "top_left"
p.axis.minor_tick_line_color = None
p.outline_line_color = None
show(p)
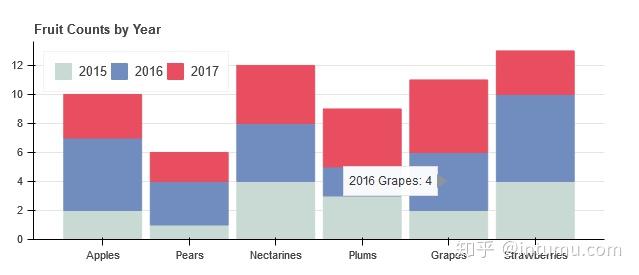
利用工具栏动态显示数据:
from bokeh.core.properties import value
from bokeh.io import show, output_file
from bokeh.plotting import figure

output_file("stacked.html")

fruits = ['Apples', 'Pears', 'Nectarines', 'Plums', 'Grapes', 'Strawberries']
years = ["2015", "2016", "2017"]
colors = ["#c9d9d3", "#718dbf", "#e84d60"]

data = {'fruits' : fruits,
        '2015'   : [2, 1, 4, 3, 2, 4],
        '2016'   : [5, 3, 4, 2, 4, 6],
        '2017'   : [3, 2, 4, 4, 5, 3]}

p = figure(x_range=fruits, plot_height=250, title="Fruit Counts by Year",
           toolbar_location=None, tools="hover", tooltips="$name @fruits: @$name")

p.vbar_stack(years, x='fruits', width=0.9, color=colors, source=data,
             legend=[value(x) for x in years])

p.y_range.start = 0
p.x_range.range_padding = 0.1
p.xgrid.grid_line_color = None
p.axis.minor_tick_line_color = None
p.outline_line_color = None
p.legend.location = "top_left"
p.legend.orientation = "horizontal"

show(p)
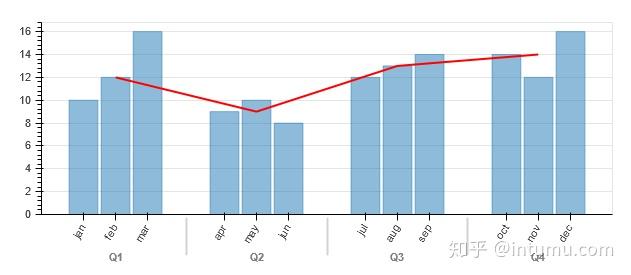
from bokeh.io import show, output_file
from bokeh.models import FactorRange
from bokeh.plotting import figure

output_file("mixed.html")

factors = [
    ("Q1", "jan"), ("Q1", "feb"), ("Q1", "mar"),
    ("Q2", "apr"), ("Q2", "may"), ("Q2", "jun"),
    ("Q3", "jul"), ("Q3", "aug"), ("Q3", "sep"),
    ("Q4", "oct"), ("Q4", "nov"), ("Q4", "dec"),

]

p = figure(x_range=FactorRange(*factors), plot_height=250,
           toolbar_location=None, tools="")

x = [ 10, 12, 16, 9, 10, 8, 12, 13, 14, 14, 12, 16 ]
p.vbar(x=factors, top=x, width=0.9, alpha=0.5)

p.line(x=["Q1", "Q2", "Q3", "Q4"], y=[12, 9, 13, 14], color="red", line_width=2)

p.y_range.start = 0
p.x_range.range_padding = 0.1
p.xaxis.major_label_orientation = 1
p.xgrid.grid_line_color = None

show(p)
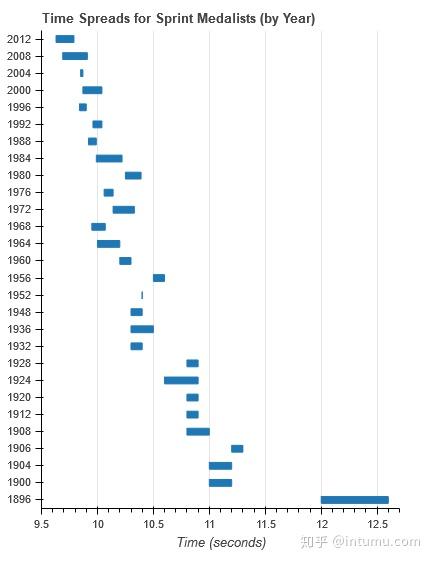
本主大爱的一种显示方式:
from bokeh.io import show, output_file
from bokeh.models import ColumnDataSource
from bokeh.plotting import figure
from bokeh.sampledata.sprint import sprint

output_file("sprint.html")

sprint.Year = sprint.Year.astype(str)
group = sprint.groupby('Year')
source = ColumnDataSource(group)

p = figure(y_range=group, x_range=(9.5,12.7), plot_width=400, plot_height=550, toolbar_location=None,
           title="Time Spreads for Sprint Medalists (by Year)")
p.hbar(y="Year", left='Time_min', right='Time_max', height=0.4, source=source)

p.ygrid.grid_line_color = None
p.xaxis.axis_label = "Time (seconds)"
p.outline_line_color = None

show(p)
友情提示:
Bokeh动态可视化非常强大,整个官方文档也只是列举了一部分,在官方Gallery中有更多牛叉的可视化案例,然并卵,很多时候还用不到,在偷懒的时候也经常选择度娘的ECharts Gallery,至于pyechart可以作为学习案例,最好自己动手重构为自己的可视化方案。