Bokeh图表布局
发布时间:2021-12-03
公开文章
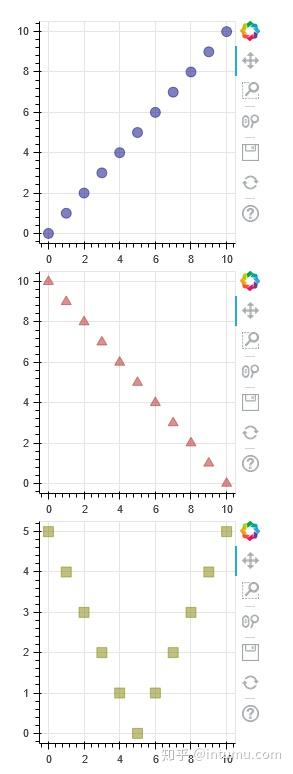
1.列布局
from bokeh.io import output_file, show
from bokeh.layouts import column
from bokeh.plotting import figure

output_file("layout.html")

x = list(range(11))
y0 = x
y1 = [10 - i for i in x]
y2 = [abs(i - 5) for i in x]

# create a new plot
s1 = figure(plot_width=250, plot_height=250, title=None)
s1.circle(x, y0, size=10, color="navy", alpha=0.5)

# create another one
s2 = figure(plot_width=250, plot_height=250, title=None)
s2.triangle(x, y1, size=10, color="firebrick", alpha=0.5)

# create and another
s3 = figure(plot_width=250, plot_height=250, title=None)
s3.square(x, y2, size=10, color="olive", alpha=0.5)

# put the results in a column and show
show(column(s1, s2, s3))
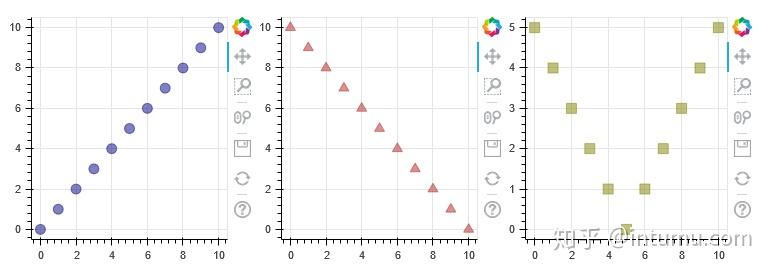
2.行布局
from bokeh.io import output_file, show
from bokeh.layouts import row
from bokeh.plotting import figure

output_file("layout.html")

x = list(range(11))
y0 = x
y1 = [10 - i for i in x]
y2 = [abs(i - 5) for i in x]

# create a new plot
s1 = figure(plot_width=250, plot_height=250, title=None)
s1.circle(x, y0, size=10, color="navy", alpha=0.5)

# create another one
s2 = figure(plot_width=250, plot_height=250, title=None)
s2.triangle(x, y1, size=10, color="firebrick", alpha=0.5)

# create and another
s3 = figure(plot_width=250, plot_height=250, title=None)
s3.square(x, y2, size=10, color="olive", alpha=0.5)

# put the results in a row
show(row(s1, s2, s3))
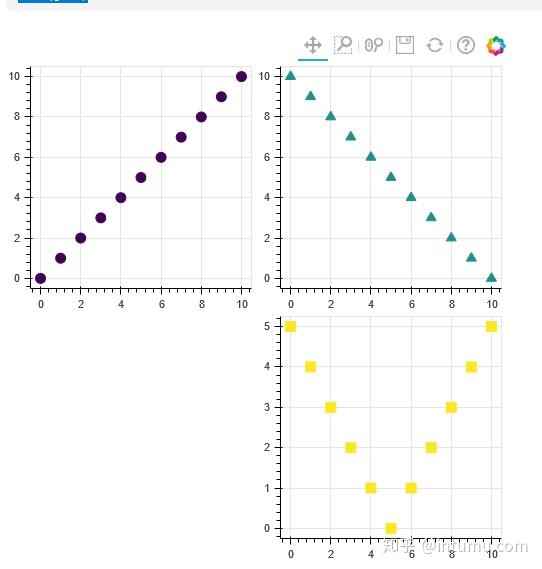
3.网格布局
from bokeh.io import output_file, show
from bokeh.layouts import gridplot
from bokeh.palettes import Viridis3
from bokeh.plotting import figure

output_file("layout_grid.html")

x = list(range(11))
y0 = x
y1 = [10 - i for i in x]
y2 = [abs(i - 5) for i in x]

# create three plots
p1 = figure(plot_width=250, plot_height=250, title=None)
p1.circle(x, y0, size=10, color=Viridis3[0])
p2 = figure(plot_width=250, plot_height=250, title=None)
p2.triangle(x, y1, size=10, color=Viridis3[1])
p3 = figure(plot_width=250, plot_height=250, title=None)
p3.square(x, y2, size=10, color=Viridis3[2])

# make a grid
grid = gridplot([[p1, p2], [None, p3]])

# show the results
show(grid)
PS:可以试试:
gridplot([[s1, s2], [s3, None]])
gridplot([s1, s2, s3], ncols=2)
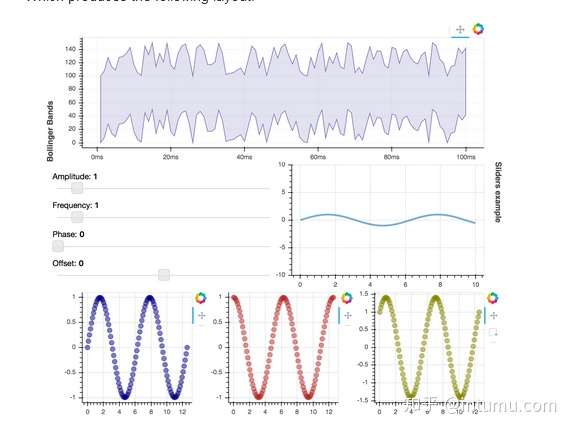
或者逐行定义:
l = layout([
[bollinger],
[sliders, plot],
[p1, p2, p3],
], sizing_mode='stretch_both')