Bokeh数据标签
发布时间:2021-12-03
公开文章
参考文档中的部分设置已经在上一讲中涉及,高级标记请参照该文档。
from bokeh.plotting import figure, show, output_file
from bokeh.models import ColumnDataSource, Range1d, LabelSet, Label
output_file("label.html", title="label.py example")
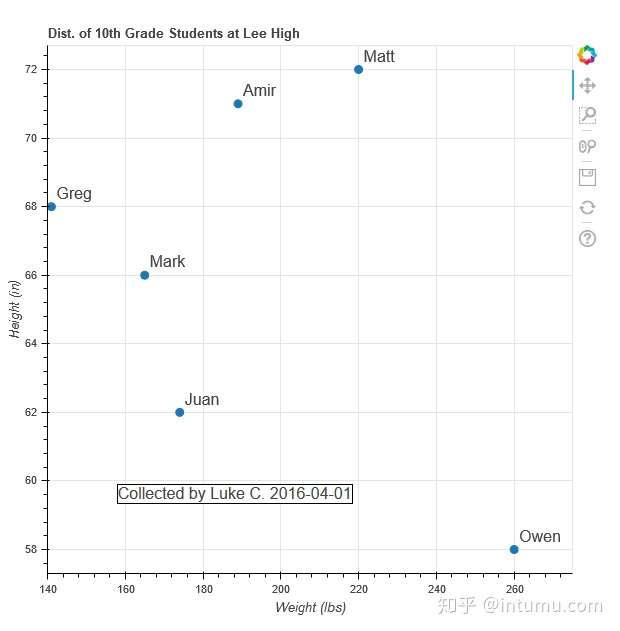
source = ColumnDataSource(data=dict(height=[66, 71, 72, 68, 58, 62],
weight=[165, 189, 220, 141, 260, 174],
names=['Mark', 'Amir', 'Matt', 'Greg',
'Owen', 'Juan']))
p = figure(title='Dist. of 10th Grade Students at Lee High',
x_range=Range1d(140, 275))
p.scatter(x='weight', y='height', size=8, source=source)
p.xaxis[0].axis_label = 'Weight (lbs)'
p.yaxis[0].axis_label = 'Height (in)'
# 一次性创建多个标签
labels = LabelSet(x='weight', y='height', text='names', level='glyph',
x_offset=5, y_offset=5, source=source, render_mode='canvas')
# 一次创建一个标签
citation = Label(x=70, y=70, x_units='screen', y_units='screen',
text='Collected by Luke C. 2016-04-01', render_mode='css',
border_line_color='black', border_line_alpha=1.0,
background_fill_color='white', background_fill_alpha=1.0)
p.add_layout(labels)
p.add_layout(citation)
show(p)
还有一种采用工具栏悬停展示数据的方法,但对中文不是很友好,有待解决: