Bokeh用基本符号绘图(核心)
发布时间:2021-12-03
公开文章
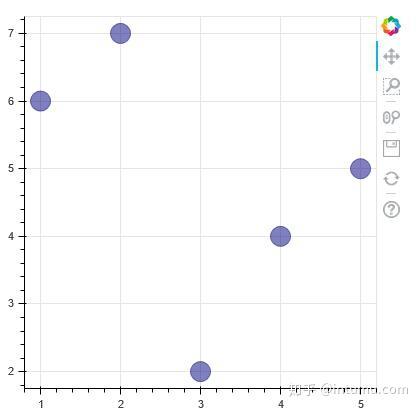
1.散点图
from bokeh.plotting import figure, output_file, show

# output to static HTML file
output_file("line.html")
# 创建画布
p = figure(plot_width=400, plot_height=400)

# add a circle renderer with a size, color, and alpha
# 根据x,y坐标绘制愿(大小、颜色、透明度)
p.circle([1, 2, 3, 4, 5], [6, 7, 2, 4, 5], size=20, color="navy", alpha=0.5)

# 显示绘制结果
# show the results
show(p)
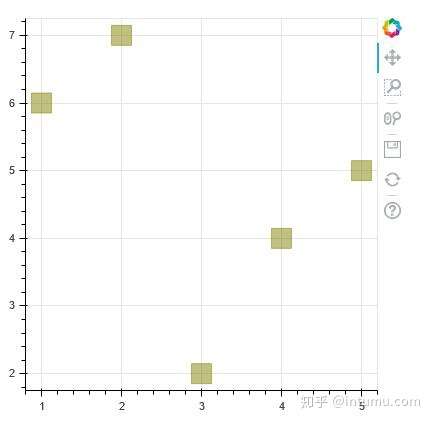
同理,可以用正方形绘制:
from bokeh.plotting import figure, output_file, show

# output to static HTML file
output_file("square.html")

p = figure(plot_width=400, plot_height=400)

# add a square renderer with a size, color, and alpha
p.square([1, 2, 3, 4, 5], [6, 7, 2, 4, 5], size=20, color="olive", alpha=0.5)

# show the results
show(p)
其他基本绘图符号:
-
asterisk() -
circle() -
circle_cross() -
circle_x() -
cross() -
dash() -
diamond() -
diamond_cross() -
inverted_triangle() -
square() -
square_cross() -
square_x() -
triangle() -
x()
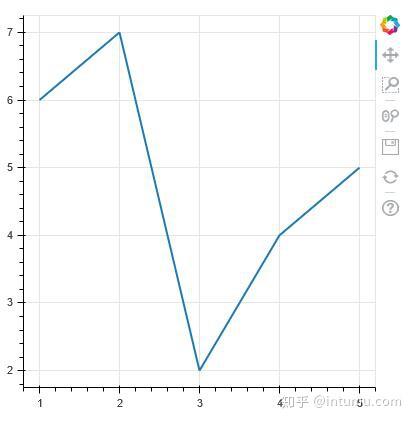
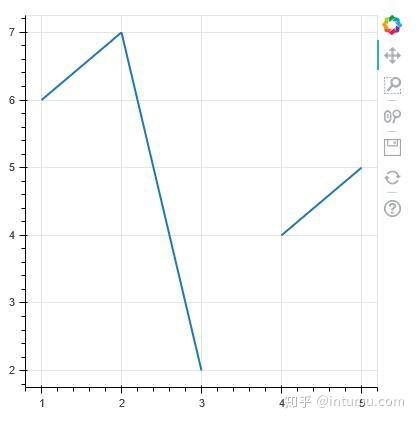
2.折线图
2.1单条折线
from bokeh.plotting import figure, output_file, show

output_file("line.html")

p = figure(plot_width=400, plot_height=400)

# add a line renderer
# x,y坐标点及线宽
p.line([1, 2, 3, 4, 5], [6, 7, 2, 4, 5], line_width=2)

show(p)
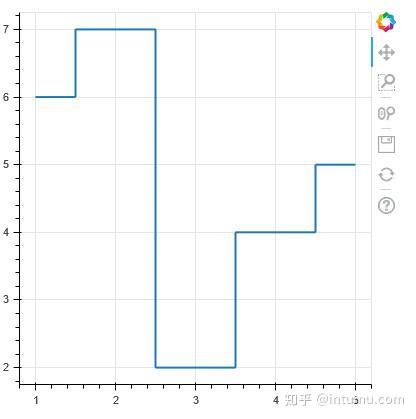
2.2阶梯折线
from bokeh.plotting import figure, output_file, show

output_file("line.html")

p = figure(plot_width=400, plot_height=400)

# add a steps renderer
p.step([1, 2, 3, 4, 5], [6, 7, 2, 4, 5], line_width=2, mode="center")

show(p)
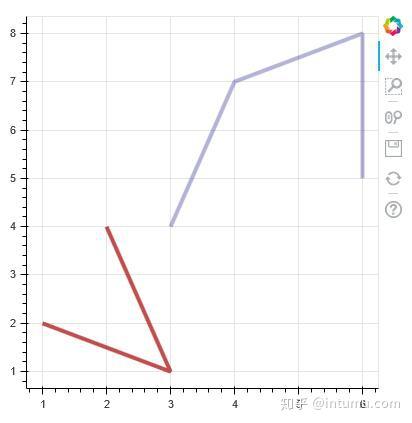
2.3多条折线
from bokeh.plotting import figure, output_file, show

output_file("patch.html")

p = figure(plot_width=400, plot_height=400)

p.multi_line([[1, 3, 2], [3, 4, 6, 6]], [[2, 1, 4], [4, 7, 8, 5]],
             color=["firebrick", "navy"], alpha=[0.8, 0.3], line_width=4)

show(p)
PS:也可以像快速入门中的示例,挨个定义单线条,然后显示。
3.缺失点
from bokeh.plotting import figure, output_file, show

output_file("line.html")

p = figure(plot_width=400, plot_height=400)

# add a line renderer with a NaN
nan = float('nan')
p.line([1, 2, 3, nan, 4, 5], [6, 7, 2, 4, 4, 5], line_width=2)

show(p)
PS:缺失点直接忽略之。在pandas中预先对缺失点进行处理(清洗)。
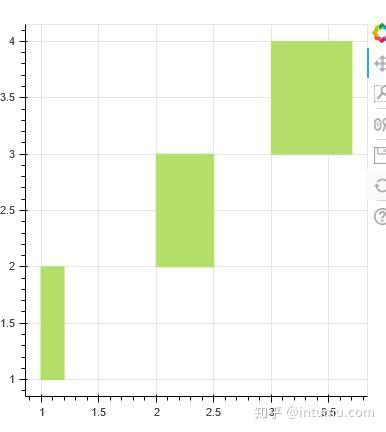
4.柱状图和矩形
4.1矩形
from bokeh.plotting import figure, show, output_file

output_file('rectangles.html')

p = figure(plot_width=400, plot_height=400)
p.quad(top=[2, 3, 4], bottom=[1, 2, 3], left=[1, 2, 3],
       right=[1.2, 2.5, 3.7], color="#B3DE69")

show(p)
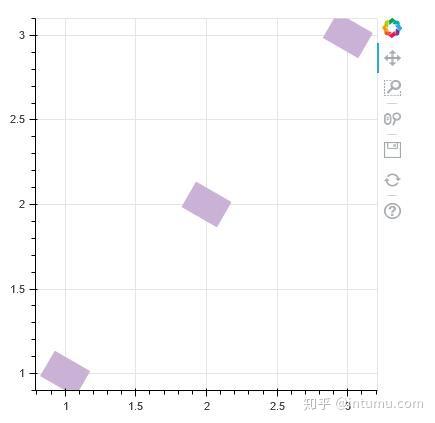
from math import pi
from bokeh.plotting import figure, show, output_file

output_file('rectangles_rotated.html')

p = figure(plot_width=400, plot_height=400)
p.rect(x=[1, 2, 3], y=[1, 2, 3], width=0.2, height=40, color="#CAB2D6",
       angle=pi/3, height_units="screen")

show(p)
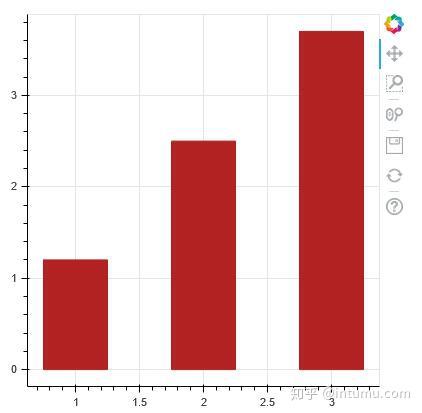
4.2柱状
纵向:
from bokeh.plotting import figure, show, output_file

output_file('vbar.html')

p = figure(plot_width=400, plot_height=400)
p.vbar(x=[1, 2, 3], width=0.5, bottom=0,
       top=[1.2, 2.5, 3.7], color="firebrick")

show(p)
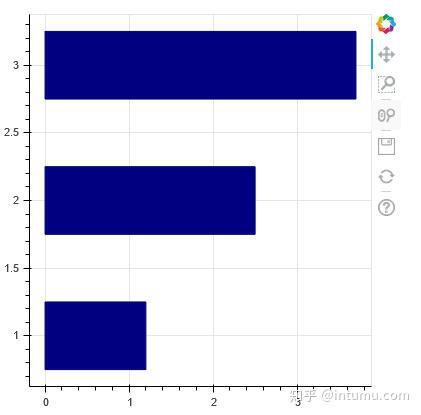
横向:
from bokeh.plotting import figure, show, output_file

output_file('hbar.html')
# 当y轴数据为字符串时,有一个坑,稍后再说~
p = figure(plot_width=400, plot_height=400)
p.hbar(y=[1, 2, 3], height=0.5, left=0,
       right=[1.2, 2.5, 3.7], color="navy")

show(p)
5.六棱块
import numpy as np

from bokeh.io import output_file, show
from bokeh.plotting import figure
from bokeh.util.hex import axial_to_cartesian

output_file("hex_coords.html")

q = np.array([0,  0, 0, -1, -1,  1, 1])
r = np.array([0, -1, 1,  0,  1, -1, 0])

p = figure(plot_width=400, plot_height=400, toolbar_location=None)
# 网格是否可见
p.grid.visible = False

# 绘制六棱块
p.hex_tile(q, r, size=1, fill_color=["firebrick"]*3 + ["navy"]*4,
           line_color="white", alpha=0.5)

# 提取六棱块中心坐标
x, y = axial_to_cartesian(q, r, 1, "pointytop")

# 标注文本,在自动标注工具中对中文不是很有少,稍后再说~
p.text(x, y, text=["(%d, %d)" % (q,r) for (q, r) in zip(q, r)],
       text_baseline="middle", text_align="center")

show(p)

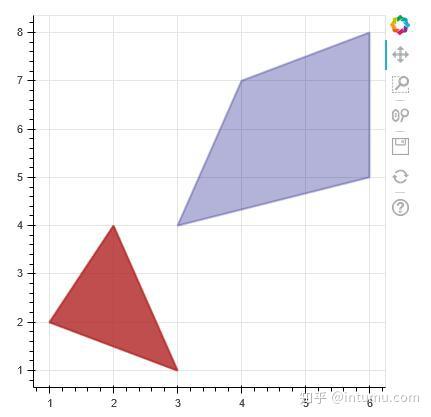
6.补丁
from bokeh.plotting import figure, output_file, show

output_file("patch.html")

p = figure(plot_width=400, plot_height=400)

p.patches([[1, 3, 2], [3, 4, 6, 6]], [[2, 1, 4], [4, 7, 8, 5]],
          color=["firebrick", "navy"], alpha=[0.8, 0.3], line_width=2)

show(p)
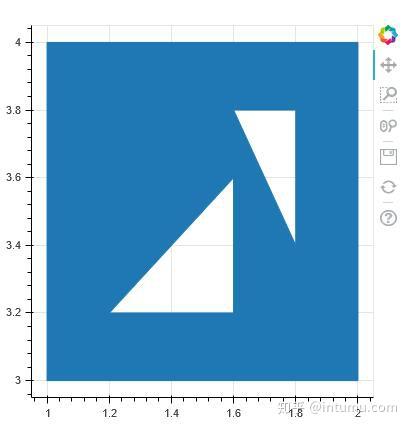
7.复杂多边形
from bokeh.plotting import figure, show, output_file

output_file('multipolygon_with_holes.html')

p = figure(plot_width=400, plot_height=400)
p.multi_polygons(xs=[[[ [1, 2, 2, 1], [1.2, 1.6, 1.6], [1.8, 1.8, 1.6] ]]],
                 ys=[[[ [3, 3, 4, 4], [3.2, 3.6, 3.2], [3.4, 3.8, 3.8] ]]])

show(p)
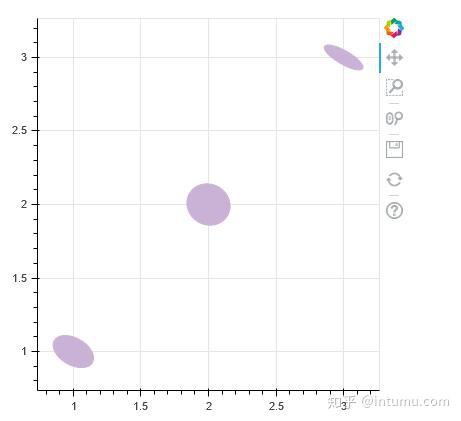
8.椭圆
from math import pi
from bokeh.plotting import figure, show, output_file

output_file('ellipses.html')

p = figure(plot_width=400, plot_height=400)
p.ellipse(x=[1, 2, 3], y=[1, 2, 3], width=[0.2, 0.3, 0.1], height=0.3,
          angle=pi/3, color="#CAB2D6")

show(p)
9.图像
import numpy as np

from bokeh.plotting import figure, output_file, show

# create an array of RGBA data
N = 20
img = np.empty((N, N), dtype=np.uint32)
view = img.view(dtype=np.uint8).reshape((N, N, 4))
for i in range(N):
    for j in range(N):
        view[i, j, 0] = int(255 * i / N)
        view[i, j, 1] = 158
        view[i, j, 2] = int(255 * j / N)
        view[i, j, 3] = 255

output_file("image_rgba.html")

p = figure(plot_width=400, plot_height=400, x_range=(0, 10), y_range=(0, 10))

p.image_rgba(image=[img], x=[0], y=[0], dw=[10], dh=[10])

show(p)

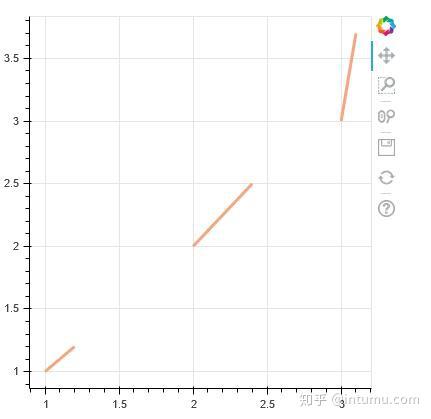
10.线段和射线
from bokeh.plotting import figure, show

p = figure(plot_width=400, plot_height=400)
p.segment(x0=[1, 2, 3], y0=[1, 2, 3], x1=[1.2, 2.4, 3.1],
          y1=[1.2, 2.5, 3.7], color="#F4A582", line_width=3)

show(p)
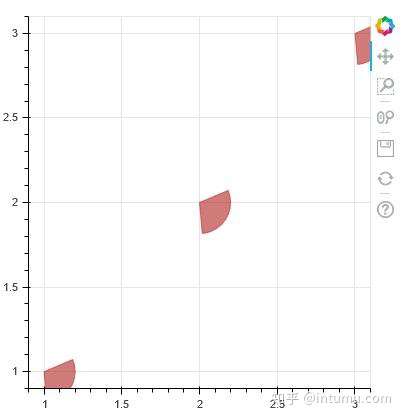
11.楔形和圆弧
from bokeh.plotting import figure, show

p = figure(plot_width=400, plot_height=400)
p.wedge(x=[1, 2, 3], y=[1, 2, 3], radius=0.2, start_angle=0.4, end_angle=4.8,
        color="firebrick", alpha=0.6, direction="clock")

show(p)
from bokeh.plotting import figure, show

p = figure(plot_width=400, plot_height=400)
p.annular_wedge(x=[1, 2, 3], y=[1, 2, 3], inner_radius=0.1, outer_radius=0.25,
                start_angle=0.4, end_angle=4.8, color="green", alpha=0.6)

show(p)
12.组合符号
from bokeh.plotting import figure, output_file, show

x = [1, 2, 3, 4, 5]
y = [6, 7, 8, 7, 3]

output_file("multiple.html")

p = figure(plot_width=400, plot_height=400)

# add both a line and circles on the same plot
p.line(x, y, line_width=2)
p.circle(x, y, fill_color="white", size=8)

show(p)
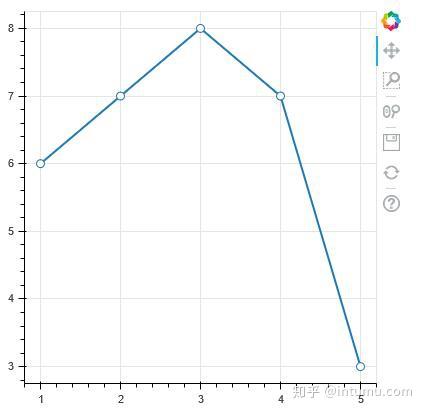
PS:如何组合让自己的图更美观,这是个问题。
13.分类轴
from bokeh.plotting import figure, output_file, show

factors = ["a", "b", "c", "d", "e", "f", "g", "h"]
x = [50, 40, 65, 10, 25, 37, 80, 60]

output_file("categorical.html")

p = figure(y_range=factors)

p.circle(x, factors, size=15, fill_color="orange", line_color="green", line_width=3)

show(p)
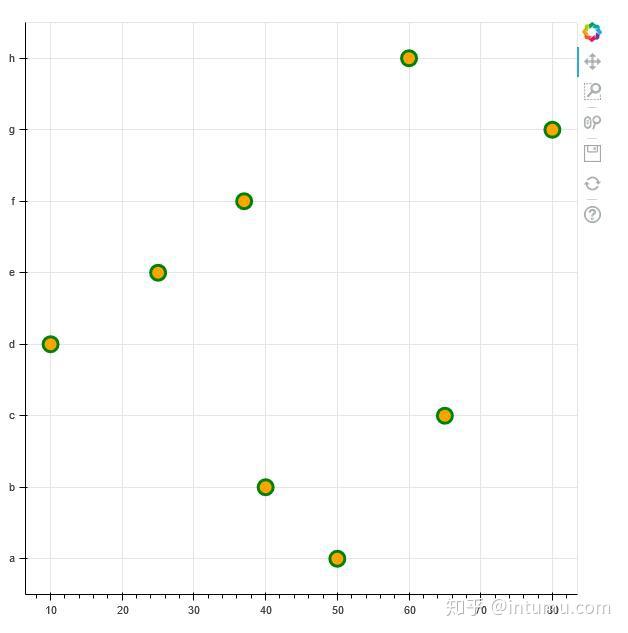
PS:之所以选择该示例,在上面横向柱状图为字符串序列时,要用到FactorRange
14.时间序列
import pandas as pd
from bokeh.plotting import figure, output_file, show
from bokeh.sampledata.stocks import AAPL

df = pd.DataFrame(AAPL)
df['date'] = pd.to_datetime(df['date'])

output_file("datetime.html")

# create a new plot with a datetime axis type
p = figure(plot_width=800, plot_height=250, x_axis_type="datetime")

p.line(df['date'], df['close'], color='navy', alpha=0.5)

show(p)
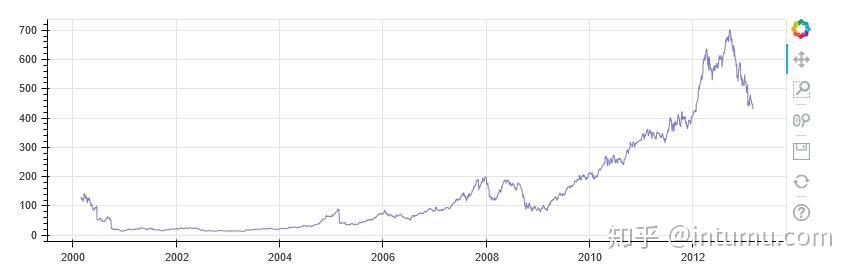
PS:横轴时间在显示月份或星期时默认英文,中文?还在发现中...
15.双坐标轴
from numpy import pi, arange, sin, linspace

from bokeh.plotting import output_file, figure, show
from bokeh.models import LinearAxis, Range1d

x = arange(-2*pi, 2*pi, 0.1)
y = sin(x)
y2 = linspace(0, 100, len(y))

output_file("twin_axis.html")

p = figure(x_range=(-6.5, 6.5), y_range=(-1.1, 1.1))

p.circle(x, y, color="red")

p.extra_y_ranges = {"foo": Range1d(start=0, end=100)}
p.circle(x, y2, color="blue", y_range_name="foo")
p.add_layout(LinearAxis(y_range_name="foo"), 'left')

show(p)
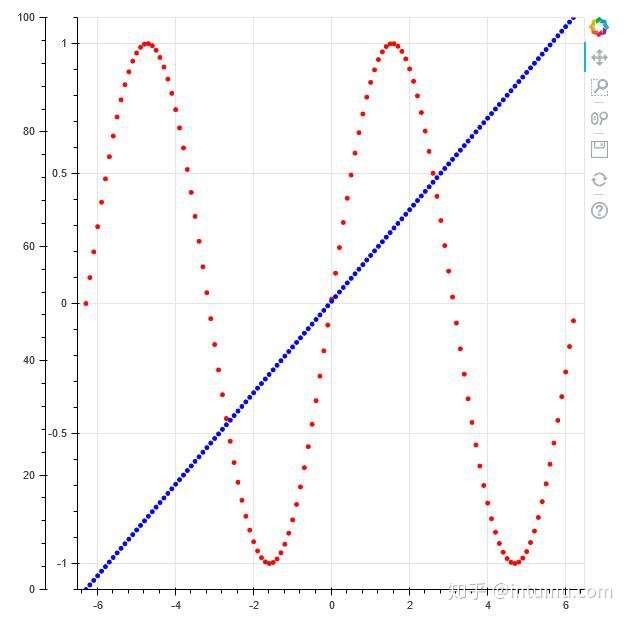
PS:本主后来发现百度echart也是挺好用的,但是向一些特殊的数据展示,还得自定义(如上图)。题外话,在应用层面,根据场景的需要,可静态、可动态(离线HTML)、可Web在线。