某国外电商销售数据探索性分析
发布时间:2023-06-04
付费文章:2.0元
Talk is cheap
import pandas as pd
import numpy as np
import datetime
import warnings
warnings.filterwarnings('ignore')
# 指定编码格式
online=pd.read_csv("../data/数据源见页底.csv")
online.head()
数据清洗
online.info()
<class 'pandas.core.frame.DataFrame'>
RangeIndex: 541909 entries, 0 to 541908
Data columns (total 8 columns):
InvoiceNo      541909 non-null object
StockCode      541909 non-null object
Description    540455 non-null object
Quantity       541909 non-null int64
InvoiceDate    541909 non-null object
UnitPrice      541909 non-null float64
CustomerID     406829 non-null float64
Country        541909 non-null object
dtypes: float64(2), int64(1), object(5)
memory usage: 33.1+ MB
online.isnull().sum().sort_values(ascending=False)
CustomerID     135080
Description      1454
Country             0
UnitPrice           0
InvoiceDate         0
Quantity            0
StockCode           0
InvoiceNo           0
dtype: int64
online[online.isnull().any(axis=1)].head()
# 刪除用戶ID为NaN的数据行
df_new = online.dropna()
df_new.isnull().sum().sort_values(ascending=False)
Country        0
CustomerID     0
UnitPrice      0
InvoiceDate    0
Quantity       0
Description    0
StockCode      0
InvoiceNo      0
dtype: int64
df_new.info()
<class 'pandas.core.frame.DataFrame'>
Int64Index: 406829 entries, 0 to 541908
Data columns (total 8 columns):
InvoiceNo      406829 non-null object
StockCode      406829 non-null object
Description    406829 non-null object
Quantity       406829 non-null int64
InvoiceDate    406829 non-null object
UnitPrice      406829 non-null float64
CustomerID     406829 non-null float64
Country        406829 non-null object
dtypes: float64(2), int64(1), object(5)
memory usage: 27.9+ MB
df_new.describe().round(2).T
df_new[df_new['Quantity'] > 0].describe().round(2)
df_new[df_new['Quantity']==80995] # 最大下单数量行
df_new[df_new['Quantity']==-80995] # 最大退货数量行
df_new.drop([540421,540422],axis=0,inplace=True) # 删除无效数据
df_new['InvoiceDate'] = pd.to_datetime(df_new['InvoiceDate'], format='%Y/%m/%d %H:%M')  # 可以用astype实现
df_new['Description'] = df_new['Description'].str.lower()
df_new.head()
df_new['CustomerID'] = df_new['CustomerID'].astype('int64')
df_new.info()
<class 'pandas.core.frame.DataFrame'>
Int64Index: 406827 entries, 0 to 541908
Data columns (total 8 columns):
InvoiceNo      406827 non-null object
StockCode      406827 non-null object
Description    406827 non-null object
Quantity       406827 non-null int64
InvoiceDate    406827 non-null datetime64[ns]
UnitPrice      406827 non-null float64
CustomerID     406827 non-null int64
Country        406827 non-null object
dtypes: datetime64[ns](1), float64(1), int64(2), object(4)
memory usage: 27.9+ MB
df_new.describe().round(2)
df_new = df_new[df_new['Quantity'] > 0]  # 删除退单数据
df_new.describe().round(2)
# 增加用户总消费额列
df_new['AmountSpent'] = df_new['Quantity'] * df_new['UnitPrice']
df_new = df_new[['InvoiceNo','InvoiceDate','StockCode','Description','Quantity','UnitPrice','AmountSpent','CustomerID','Country']]
df_new.head()
# 增加不同消费频段,多指标统计消费数
df_new.insert(loc=2, column='YearMonth', value=df_new['InvoiceDate'].map(lambda x: 100*x.year + x.month))
df_new.insert(loc=3, column='month', value=df_new['InvoiceDate'].dt.month)
df_new.insert(loc=4, column='day', value=(df_new['InvoiceDate'].dt.dayofweek)+1) # +1 星期一=1.....星期天=7
df_new.insert(loc=5, column='hour', value=df_new['InvoiceDate'].dt.hour)
df_new.head()
探索性数据分析
整体分析
oders = df_new.groupby(by=['CustomerID','Country'], as_index=False)['InvoiceNo'].count()
oders.head()
from bokeh.plotting import figure, show, output_notebook
from bokeh.layouts import gridplot
from bokeh.models import ColumnDataSource,SingleIntervalTicker
from math import pi
output_notebook()
<div class="bk-root">
    <a href="https://bokeh.pydata.org" target="_blank" class="bk-logo bk-logo-small bk-logo-notebook">a>
    <span id="6694">Loading BokehJS ...span>
div>
p = figure(plot_width=800, plot_height=550,title="客户订单数")
p.vbar(x="CustomerID", top='InvoiceNo', width=0.4, source=oders)
p.yaxis.axis_label = '客户ID'
p.yaxis.axis_label = '订单数'
p.xaxis.major_label_orientation=pi/4
p.y_range.start=0
show(p)
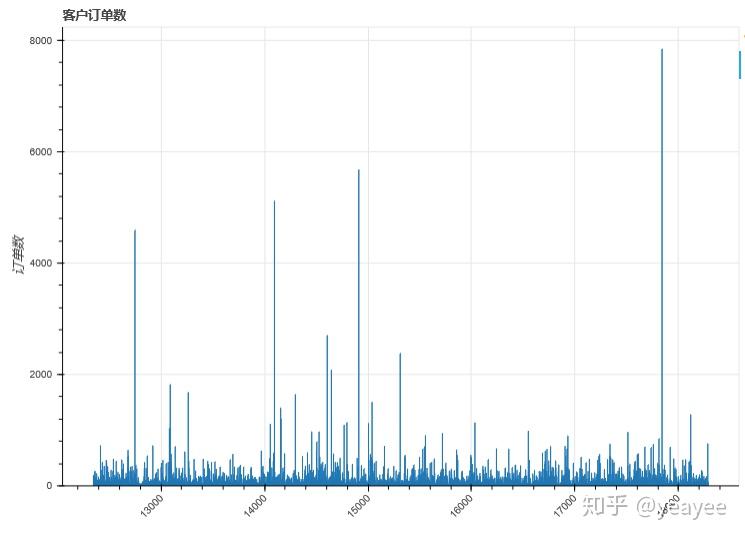
print('订单最多的5大客户:')
df_Cus_Cou.sort_values(by='InvoiceNo', ascending=False).head()  # 大单数
订单最多的5大客户:
money_spent = df_new.groupby(by=['CustomerID','Country'], as_index=False)['AmountSpent'].sum()
money_spent.head()
p = figure(plot_width=800, plot_height=550,title="客户消费金额")
p.vbar(x="CustomerID", top='AmountSpent', width=0.4, source=money_spent)
p.yaxis.axis_label = '客户ID'
p.yaxis.axis_label = '消费金额 (美元)'
p.xaxis.major_label_orientation=pi/4
p.y_range.start=0
show(p)
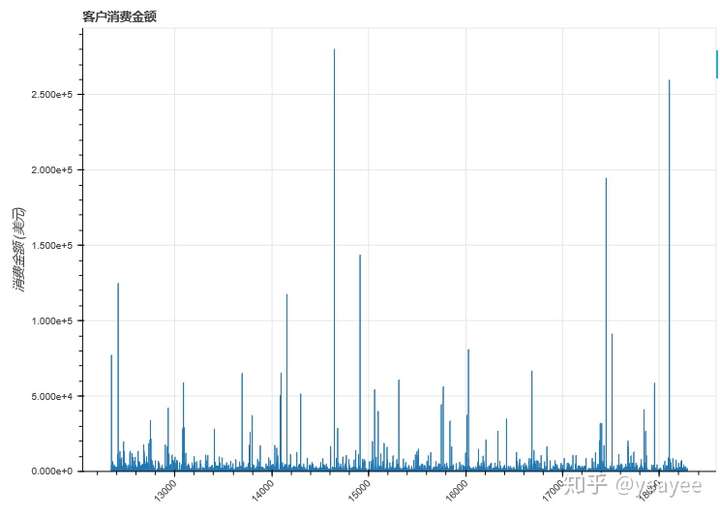
money_spent.sort_values(by='AmountSpent', ascending=False).head() # 大客户每月订单数
df_new.head()
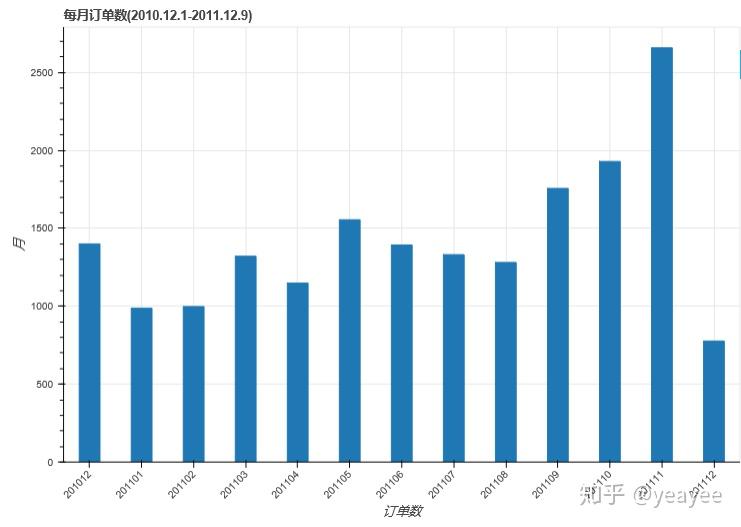
oders_M = df_new.groupby('InvoiceNo')['YearMonth'].unique().value_counts().sort_index().reset_index()
oders_M['index'] = [str(i[0]) for i in oders_M['index'].to_list()]
p = figure(plot_width=800, plot_height=550,x_range=oders_M['index'].to_list(),title="每月订单数(2010.12.1-2011.12.9)")
p.vbar(x="index", top='YearMonth', width=0.4, source = oders_M )
p.yaxis.axis_label = '月'
p.xaxis.axis_label = '订单数'
p.xaxis.major_label_orientation=pi/4
p.y_range.start=0
show(p)
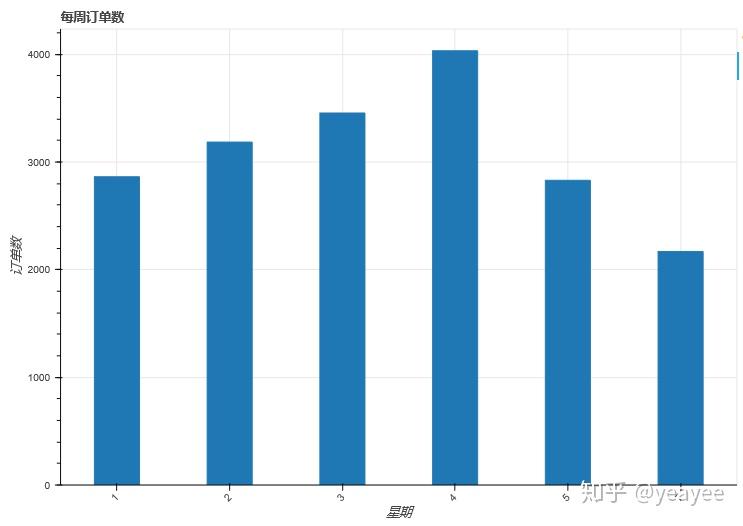
每周订单数
oders_W = df_new.groupby('InvoiceNo')['day'].unique().value_counts().sort_index().reset_index()
oders_W['index'] = [str(i[0]) for i in oders_W['index'].to_list()]
p = figure(plot_width=800, plot_height=550,x_range=oders_W['index'].to_list(),title="每周订单数")
p.vbar(x="index", top='day', width=0.4, source = oders_W )
p.xaxis.axis_label = '星期'
p.yaxis.axis_label = '订单数'
p.xaxis.major_label_orientation=pi/4
p.y_range.start=0
show(p)
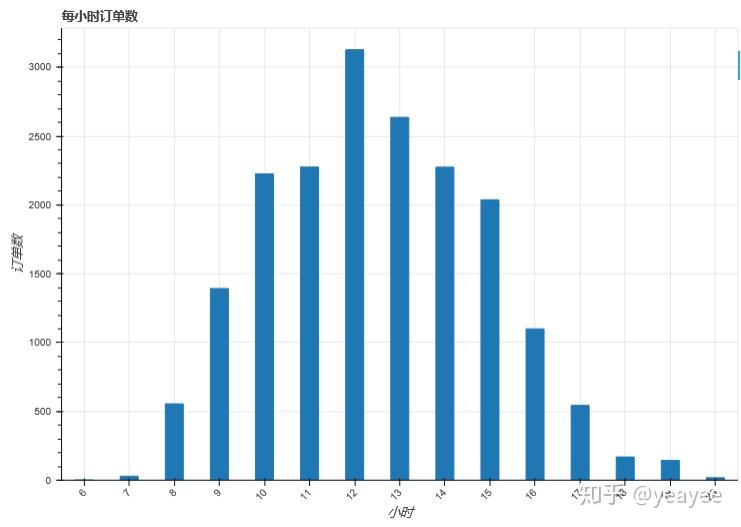
每小时订单数
oders_H = df_new.groupby('InvoiceNo')['hour'].unique().value_counts().iloc[:-1].sort_index().reset_index()
oders_H['index'] = [str(i[0]) for i in oders_H['index'].to_list()]
oders_H.head()
p = figure(plot_width=800, plot_height=550,x_range=oders_H['index'].to_list(),title="每小时订单数")
p.vbar(x="index", top='hour', width=0.4, source = oders_H )
p.xaxis.axis_label = '小时'
p.yaxis.axis_label = '订单数'
p.xaxis.major_label_orientation=pi/4
p.y_range.start=0
show(p)
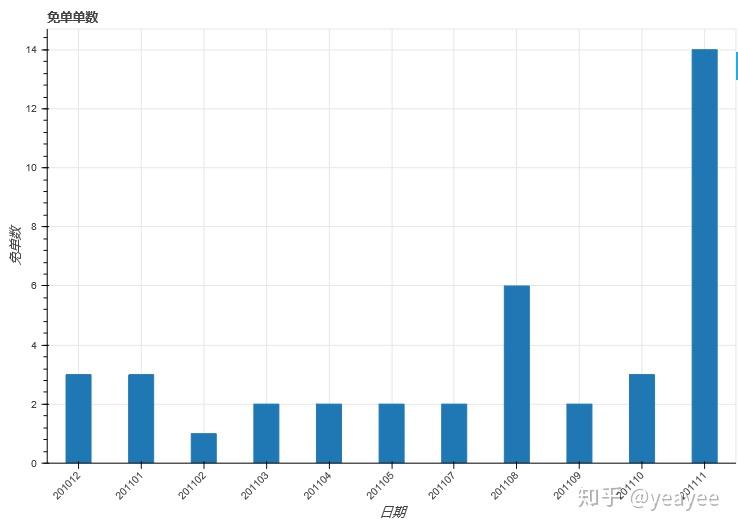
价格分布
df_new['UnitPrice'].describe()  # min=0 有免费领产品
count    397923.000000
mean          3.116177
std          22.096816
min           0.000000
25%           1.250000
50%           1.950000
75%           3.750000
max        8142.750000
Name: UnitPrice, dtype: float64
df_free = df_new[df_new['UnitPrice'] == 0]
df_free.head()
oders_F = df_free['YearMonth'].value_counts().sort_index().reset_index()
oders_F['index'] = [str(i) for i in oders_F['index'].to_list()]
oders_F.head()
p = figure(plot_width=800, plot_height=550,x_range=oders_F['index'].to_list(),title="免单单数")
p.vbar(x="index", top='YearMonth', width=0.4, source = oders_F )
p.xaxis.axis_label = '日期'
p.yaxis.axis_label = '免单数'
p.xaxis.major_label_orientation=pi/4
p.y_range.start=0
show(p)
group_country_orders = df_new.groupby('Country')['InvoiceNo'].count().sort_values().reset_index()
p = figure(y_range=group_country_orders['Country'],
           plot_width=800, plot_height=20*group_country_orders.shape[0], x_axis_location='above',
           title="各国订单数")
p.hbar(y="Country", right='InvoiceNo', height=0.4, source=group_country_orders) # 水平柱状图
p.xaxis.axis_label = '订单数'
p.yaxis.axis_label = '国家'
p.x_range.start=0
show(p)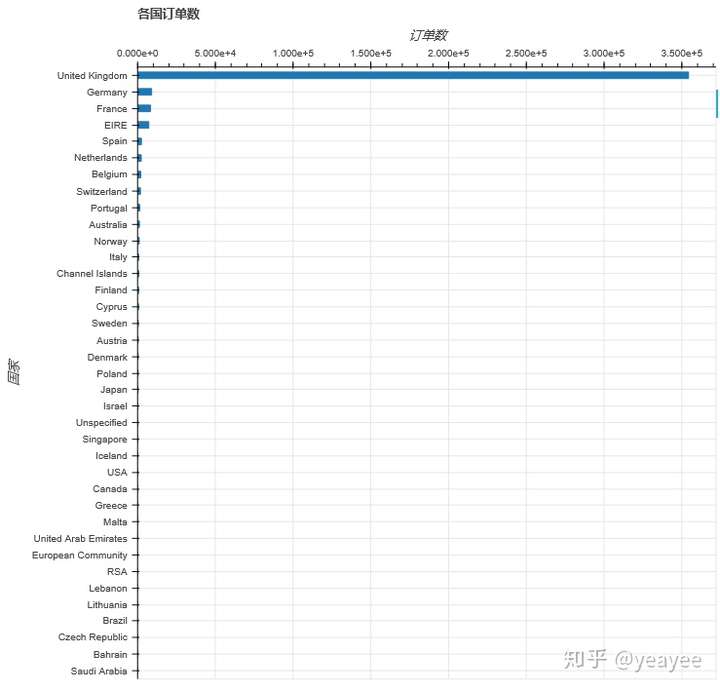
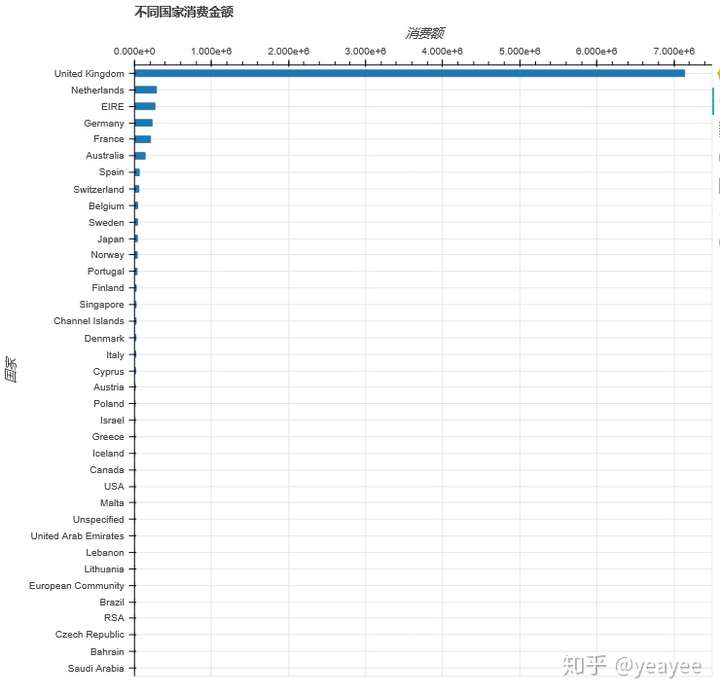
group_country_amount_spent = df_new.groupby('Country')['AmountSpent'].sum().sort_values().reset_index()
group_country_amount_spent.head()
p = figure(y_range=group_country_amount_spent['Country'],
           plot_width=800, plot_height=20*group_country_amount_spent.shape[0], x_axis_location='above',
           title="不同国家消费金额")
p.hbar(y="Country", right='AmountSpent', height=0.4, source=group_country_amount_spent) # 水平柱状图
p.xaxis.axis_label = '消费额'
p.yaxis.axis_label = '国家'
p.x_range.start=0
show(p)
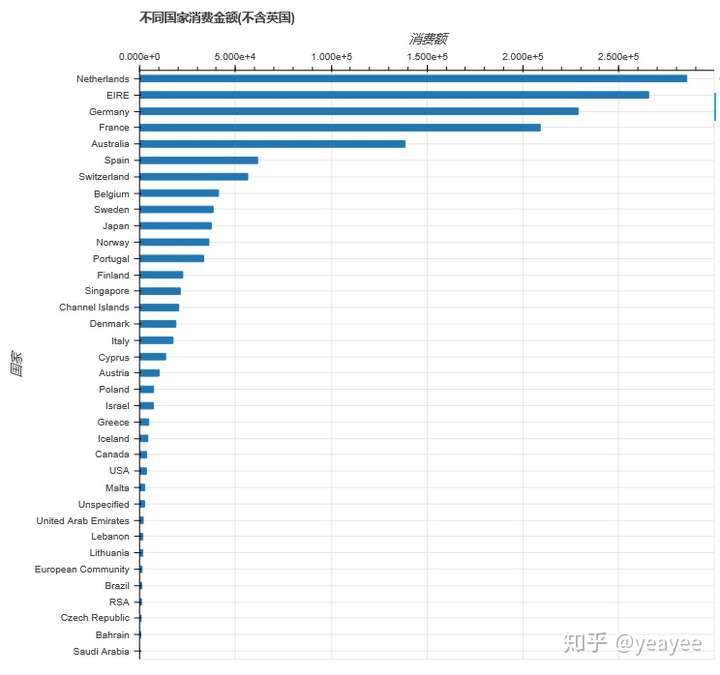
group_country_amount_spent=group_country_amount_spent[:-1]
p = figure(y_range=group_country_amount_spent['Country'],
           plot_width=800, plot_height=20*group_country_amount_spent.shape[0], x_axis_location='above',
           title="不同国家消费金额(不含英国)")
p.hbar(y="Country", right='AmountSpent', height=0.4, source=group_country_amount_spent) # 水平柱状图
p.xaxis.axis_label = '消费额'
p.yaxis.axis_label = '国家'
p.x_range.start=0
show(p)
打赏2.0元
手机端:用系统浏览器访问本链接,打开支付宝完成打赏
订单号示例
1.微信中:截图保存支付宝绿码,支付宝扫码打赏,手动获取;
2.电脑端:使用手机支付宝直接扫绿码,完成打赏,自动获取;