GBDT产品定价模型
发布时间:2021-12-03
公开文章
模型搭建
1.读取数据
import pandas as pd
df = pd.read_excel('------.xlsx')
df.head()
页数 类别 彩印 纸张 价格 0 207 技术类 0 双胶纸 60 1 210 技术类 0 双胶纸 62 2 206 技术类 0 双胶纸 62 3 218 技术类 0 双胶纸 64 4 209 技术类 0 双胶纸 60
查看各个分类的数据量
df['类别'].value_counts()
技术类    336
教辅类    333
办公类    331
Name: 类别, dtype: int64
df['彩印'].value_counts()
0    648
1    352
Name: 彩印, dtype: int64
df['纸张'].value_counts()
双胶纸    615
铜版纸    196
书写纸    189
Name: 纸张, dtype: int64
2.分类型文本变量处理
将文本内容转为数值,关于LabelEncoder()函数也在将在11.1.2节进行进一步讲解
from sklearn.preprocessing import LabelEncoder
le = LabelEncoder()
df['类别'] = le.fit_transform(df['类别'])  # 处理类别
# 将类别一列处理后,我们可以使用value_counts()方法查看转化效果:
df['类别'].value_counts()
1    336
2    333
0    331
Name: 类别, dtype: int64
# 另外一种文本内容转为数值的方法,注意不要再运行完上面的代码后运行,因为上面的内容已经被替代完毕了,如果想尝试,需要重新运行,并且,先运行下面的代码
# df['类别'] = df['类别'].replace({'办公类': 0, '技术类': 1, '教辅类': 2})
# df['类别'].value_counts()
# 下面我们使用同样的方法处理“纸张”一列:
le = LabelEncoder()
df['纸张'] = le.fit_transform(df['纸张'])
# 此时的表格如下:
df.head()
页数 类别 彩印 纸张 价格 0 207 1 0 1 60 1 210 1 0 1 62 2 206 1 0 1 62 3 218 1 0 1 64 4 209 1 0 1 60
3.提取特征变量和目标变量
X = df.drop(columns='价格')
y = df['价格']
4.划分训练集和测试集
from sklearn.model_selection import train_test_split
X_train, X_test, y_train, y_test = train_test_split(X, y, test_size=0.2, random_state=123)
5.模型训练及搭建
from sklearn.ensemble import GradientBoostingRegressor
model = GradientBoostingRegressor(random_state=123)
model.fit(X_train, y_train)
GradientBoostingRegressor(alpha=0.9, criterion='friedman_mse', init=None,
             learning_rate=0.1, loss='ls', max_depth=3, max_features=None,
             max_leaf_nodes=None, min_impurity_decrease=0.0,
             min_impurity_split=None, min_samples_leaf=1,
             min_samples_split=2, min_weight_fraction_leaf=0.0,
             n_estimators=100, n_iter_no_change=None, presort='auto',
             random_state=123, subsample=1.0, tol=0.0001,
             validation_fraction=0.1, verbose=0, warm_start=False)
模型预测及评估
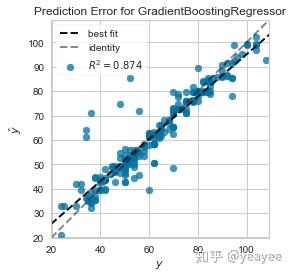
1.R2分数
from yellowbrick.regressor import PredictionError
visualizer = PredictionError(model)
visualizer.fit(X_train, y_train)
print('得分:',visualizer.score(X_test,y_test))
visualizer.poof()
得分: 0.8741691363311168

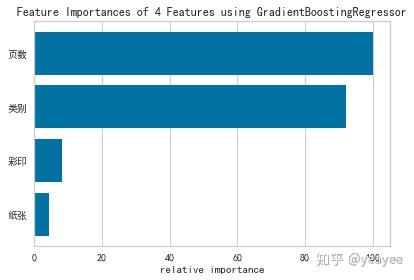
2.查看特征重要性
import matplotlib
matplotlib.rcParams['font.sans-serif']=['SimHei']
matplotlib.rcParams['axes.unicode_minus']=False  # 用来正常显示负号
from yellowbrick.features.importances import FeatureImportances
viz = FeatureImportances(model)
viz.fit(X, y)
viz.poof()

3.模型参数(选学)
# # 分类模型,通过如下代码可以查看官方介绍
# from sklearn.ensemble import AdaBoostClassifier
# AdaBoostClassifier?
# # 回归模型,通过如下代码可以查看官方介绍
# from sklearn.ensemble import AdaBoostRegressor
# AdaBoostRegressor?