数据挖掘之SVM分类
发布时间:2021-12-03
公开文章
继续用k-means的案例,进行SVM无监督预测分类:
import numpy as np
#Create fake income/age clusters for N people in k clusters
def createClusteredData(N, k):
pointsPerCluster = float(N)/k
X = []
y = []
for i in range (k):
incomeCentroid = np.random.uniform(20000.0, 200000.0)
ageCentroid = np.random.uniform(20.0, 70.0)
for j in range(int(pointsPerCluster)):
X.append([np.random.normal(incomeCentroid, 10000.0), np.random.normal(ageCentroid, 2.0)])
y.append(i)
X = np.array(X)
y = np.array(y)
return X, y
import numpy as np
# 创建数据集:根据年龄和收入
def createClusteredData(N, k):
pointsPerCluster = float(N)/k
X = []
y = []
for i in range (k):
incomeCentroid = np.random.uniform(20000.0, 200000.0)
ageCentroid = np.random.uniform(20.0, 70.0)
for j in range(int(pointsPerCluster)):
X.append([np.random.normal(incomeCentroid, 10000.0), np.random.normal(ageCentroid, 2.0)])
y.append(i)
X = np.array(X)
y = np.array(y)
return X, y
%matplotlib inline
from pylab import *
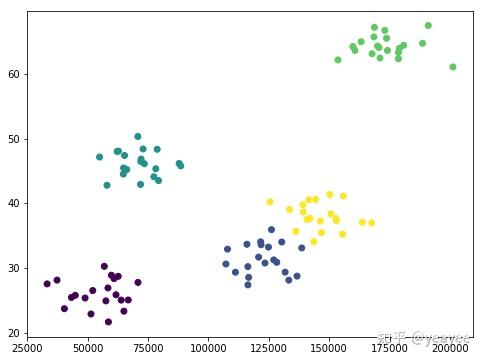
(X, y) = createClusteredData(100, 5) # 分为五类数据
plt.figure(figsize=(8, 6))
plt.scatter(X[:,0], X[:,1], c=y.astype(np.float))
plt.show()
from sklearn import svm, datasets
C = 1.0
svc = svm.SVC(kernel='linear', C=C).fit(X, y)
from sklearn import svm, datasets
C = 1.0
svc = svm.SVC(kernel='linear', C=C).fit(X, y)
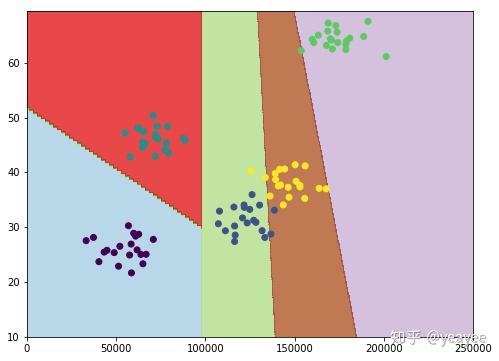
def plotPredictions(clf):
xx, yy = np.meshgrid(np.arange(0, 250000, 10),
np.arange(10, 70, 0.5))
Z = clf.predict(np.c_[xx.ravel(), yy.ravel()])
plt.figure(figsize=(8, 6))
Z = Z.reshape(xx.shape) # 绘制登高线图,为xx*yy范围内点的高程数据(垂直于直面方向)
plt.contourf(xx, yy, Z, cmap=plt.cm.Paired, alpha=0.8)
plt.scatter(X[:,0], X[:,1], c=y.astype(np.float))
plt.show()
plotPredictions(svc)
xx, yy = np.meshgrid(np.arange(0, 250000, 10),
             np.arange(10, 70, 0.5))
Z = svc.predict(np.c_[xx.ravel(), yy.ravel()])
Z
array([0, 0, 0, ..., 3, 3, 3])
Z = Z.reshape(xx.shape) # 将上面的一维数据转换为与xx相同的维度
Z
array([[0, 0, 0, ..., 3, 3, 3],
       [0, 0, 0, ..., 3, 3, 3],
       [0, 0, 0, ..., 3, 3, 3],
       ...,
       [2, 2, 2, ..., 3, 3, 3],
       [2, 2, 2, ..., 3, 3, 3],
       [2, 2, 2, ..., 3, 3, 3]])
y # 具体分类
array([0, 0, 0, 0, 0, 0, 0, 0, 0, 0, 0, 0, 0, 0, 0, 0, 0, 0, 0, 0, 1, 1,
       1, 1, 1, 1, 1, 1, 1, 1, 1, 1, 1, 1, 1, 1, 1, 1, 1, 1, 2, 2, 2, 2,
       2, 2, 2, 2, 2, 2, 2, 2, 2, 2, 2, 2, 2, 2, 2, 2, 3, 3, 3, 3, 3, 3,
       3, 3, 3, 3, 3, 3, 3, 3, 3, 3, 3, 3, 3, 3, 4, 4, 4, 4, 4, 4, 4, 4,
       4, 4, 4, 4, 4, 4, 4, 4, 4, 4, 4, 4])
print(svc.predict([[200000, 40]]))  # 收入、年龄,预测分类
[3]
print(svc.predict([[50000, 65]]))
[2]