数据挖掘之k-Means分类
发布时间:2021-12-03
公开文章
from numpy import random, array

#Create fake income/age clusters for N people in k clusters
def createClusteredData(N, k):
    random.seed(10)
    pointsPerCluster = float(N)/k
    X = []
    for i in range (k):
        incomeCentroid = random.uniform(20000.0, 200000.0)
        ageCentroid = random.uniform(20.0, 70.0)
        for j in range(int(pointsPerCluster)):
            X.append([random.normal(incomeCentroid, 10000.0), random.normal(ageCentroid, 2.0)])
    X = array(X)
    return X
from numpy import random, array

# 创建数据集:根据年龄和收入,分为k类(k-Means)
def createClusteredData(N, k):
    random.seed(10)
    pointsPerCluster = float(N)/k
    X = []
    for i in range (k):
        incomeCentroid = random.uniform(20000.0, 200000.0)
        ageCentroid = random.uniform(20.0, 70.0)
        for j in range(int(pointsPerCluster)):
            X.append([random.normal(incomeCentroid, 10000.0), random.normal(ageCentroid, 2.0)])
    X = array(X)
    return X
%matplotlib inline

from sklearn.cluster import KMeans
import matplotlib.pyplot as plt
from sklearn.preprocessing import scale
from numpy import random, float

data = createClusteredData(100, 5)

model = KMeans(n_clusters=5)

# Note I'm scaling the data to normalize it! Important for good results.
model = model.fit(scale(data))

# We can look at the clusters each data point was assigned to
print(model.labels_)

# And we'll visualize it:
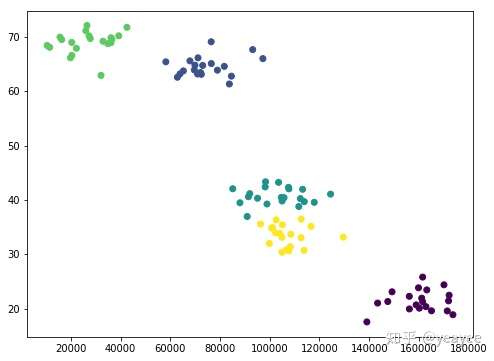
plt.figure(figsize=(8, 6))
plt.scatter(data[:,0], data[:,1], c=model.labels_.astype(float))
plt.show()
[0 0 0 0 0 0 0 0 0 0 0 0 0 0 0 0 0 0 0 0 1 1 1 1 1 1 1 1 1 1 1 1 1 1 1 1 1
 1 1 1 4 4 4 4 4 4 4 4 4 4 4 4 4 4 4 4 4 4 4 2 3 3 3 3 3 3 3 3 3 3 3 3 3 3
 3 3 3 3 3 3 2 2 2 2 2 2 2 2 2 2 2 2 2 2 2 2 2 2 2 2]

%matplotlib inline

from sklearn.cluster import KMeans
import matplotlib.pyplot as plt
from sklearn.preprocessing import scale
from numpy import random, float

data = createClusteredData(100, 5)  # 创建数据:100人,5类

model = KMeans(n_clusters=5)

# 用scale归一化数据(标准化、归一化的作用自行搜索)
model = model.fit(scale(data))
# 可视化
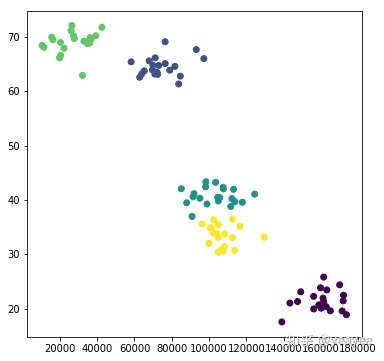
plt.figure(figsize=(6, 6))
plt.scatter(data[:,0], data[:,1], c=model.labels_.astype(float))
plt.show()

# 可以查看每个数据点的分类情况
print(model.labels_)
[0 0 0 0 0 0 0 0 0 0 0 0 0 0 0 0 0 0 0 0 1 1 1 1 1 1 1 1 1 1 1 1 1 1 1 1 1
 1 1 1 4 4 4 4 4 4 4 4 4 4 4 4 4 4 4 4 4 4 4 2 3 3 3 3 3 3 3 3 3 3 3 3 3 3
 3 3 3 3 3 3 2 2 2 2 2 2 2 2 2 2 2 2 2 2 2 2 2 2 2 2]