数据预处理:特征选择
发布时间:2021-12-03
公开文章
过滤式特征选择VarianceThreshold
from sklearn.feature_selection import  VarianceThreshold,SelectKBest,f_classif

def test_VarianceThreshold():
    '''
    测试 VarianceThreshold  的用法

    :return:  None
    '''
    X=[[100,1,2,3],
       [100,4,5,6],
       [100,7,8,9],
       [101,11,12,13]]
    selector=VarianceThreshold(1)
    selector.fit(X)
    print("Variances is %s"%selector.variances_)
    print("After transform is %s"%selector.transform(X))
    print("The surport is %s"%selector.get_support(True))
    print("After reverse transform is %s"%
            selector.inverse_transform(selector.transform(X)))
test_VarianceThreshold()
Variances is [ 0.1875 13.6875 13.6875 13.6875]
After transform is [[ 1  2  3]
 [ 4  5  6]
 [ 7  8  9]
 [11 12 13]]
The surport is [1 2 3]
After reverse transform is [[ 0  1  2  3]
 [ 0  4  5  6]
 [ 0  7  8  9]
 [ 0 11 12 13]]
def test_SelectKBest():
    '''
    测试 SelectKBest  的用法,其中考察的特征指标是 f_classif

    :return:  None
    '''
    X=[   [1,2,3,4,5],
          [5,4,3,2,1],
          [3,3,3,3,3,],
          [1,1,1,1,1] ]
    y=[0,1,0,1]
    print("before transform:",X)
    selector=SelectKBest(score_func=f_classif,k=3) # k=3
    selector.fit(X,y)
    print("scores_:",selector.scores_)
    print("pvalues_:",selector.pvalues_)
    print("selected index:",selector.get_support(True))
    print("after transform:",selector.transform(X))
test_SelectKBest()
before transform: [[1, 2, 3, 4, 5], [5, 4, 3, 2, 1], [3, 3, 3, 3, 3], [1, 1, 1, 1, 1]]
scores_: [0.2 0.  1.  8.  9. ]
pvalues_: [0.69848865 1.         0.42264974 0.10557281 0.09546597]
selected index: [2 3 4]
after transform: [[3 4 5]
 [3 2 1]
 [3 3 3]
 [1 1 1]]
包裹式特征选择RFE,RFECV
from sklearn.feature_selection import  RFE,RFECV
from sklearn.svm import LinearSVC
from sklearn.datasets import  load_iris
from sklearn.model_selection import train_test_split

def test_RFE():
    '''
    测试 RFE 的用法,其中目标特征数量为 2

    :return: None
    '''
    iris=load_iris()
    X=iris.data
    y=iris.target
    estimator=LinearSVC()
    selector=RFE(estimator=estimator,n_features_to_select=2)
    selector.fit(X,y)
    print("N_features %s"%selector.n_features_)
    print("Support is %s"%selector.support_)
    print("Ranking %s"%selector.ranking_)
def test_RFECV():
    '''
    测试 RFECV 的用法

    :return:  None
    '''
    iris=load_iris()
    X=iris.data
    y=iris.target
    estimator=LinearSVC()
    selector=RFECV(estimator=estimator,cv=3)
    selector.fit(X,y)
    print("N_features %s"%selector.n_features_)
    print("Support is %s"%selector.support_)
    print("Ranking %s"%selector.ranking_)
    print("Grid Scores %s"%selector.grid_scores_)
def test_compare_with_no_feature_selection():
    '''
    比较经过特征选择和未经特征选择的数据集,对 LinearSVC 的预测性能的区别

    :return: None
    '''
    ### 加载数据
    iris=load_iris()
    X,y=iris.data,iris.target
    ### 特征提取
    estimator=LinearSVC()
    selector=RFE(estimator=estimator,n_features_to_select=2)
    X_t=selector.fit_transform(X,y)
    #### 切分测试集与验证集
    X_train,X_test,y_train,y_test=train_test_split(X, y,
                test_size=0.25,random_state=0,stratify=y)
    X_train_t,X_test_t,y_train_t,y_test_t=train_test_split(X_t, y,
                test_size=0.25,random_state=0,stratify=y)
    ### 测试与验证
    clf=LinearSVC()
    clf_t=LinearSVC()
    clf.fit(X_train,y_train)
    clf_t.fit(X_train_t,y_train_t)
    print("Original DataSet: test score=%s"%(clf.score(X_test,y_test)))
    print("Selected DataSet: test score=%s"%(clf_t.score(X_test_t,y_test_t)))
test_RFE() # 调用 test_RFE
N_features 2
Support is [False  True False  True]
Ranking [3 1 2 1]
test_compare_with_no_feature_selection() # 调用 test_compare_with_no_feature_selection
Original DataSet: test score=0.9473684210526315
Selected DataSet: test score=0.9473684210526315
test_RFECV() # 调用 test_RFECV
N_features 4
Support is [ True  True  True  True]
Ranking [1 1 1 1]
Grid Scores [0.91421569 0.94689542 0.95383987 0.96691176]
嵌入式特征选择
from sklearn.feature_selection import  SelectFromModel
from sklearn.svm import LinearSVC
from sklearn.datasets import  load_digits,load_diabetes
import numpy as np
import  matplotlib.pyplot as plt
from sklearn.linear_model import Lasso

def test_SelectFromModel():
    '''
    测试 SelectFromModel 的用法。

    :return: None
    '''
    digits=load_digits()
    X=digits.data
    y=digits.target
    estimator=LinearSVC(penalty='l1',dual=False)
    selector=SelectFromModel(estimator=estimator,threshold='mean')
    selector.fit(X,y)
    selector.transform(X)
    print("Threshold %s"%selector.threshold_)
    print("Support is %s"%selector.get_support(indices=True))
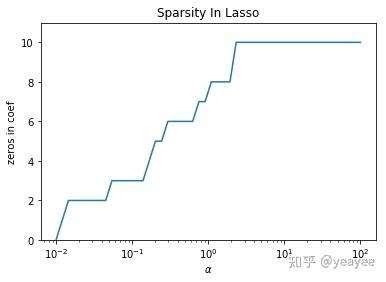
def test_Lasso(*data):
    '''
    测试 alpha 与稀疏性的关系

    :param data: 可变参数。它是一个元组,这里要求其元素依次为:训练样本集、测试样本集、训练样本的值、测试样本的值
    :return: None
    '''
    X,y=data
    alphas=np.logspace(-2,2)
    zeros=[]
    for alpha in alphas:
        regr=Lasso(alpha=alpha)
        regr.fit(X,y)
        ### 计算零的个数 ###
        num=0
        for ele in regr.coef_:
            if abs(ele) < 1e-5:num+=1
        zeros.append(num)
    ##### 绘图
    fig=plt.figure()
    ax=fig.add_subplot(1,1,1)
    ax.plot(alphas,zeros)
    ax.set_xlabel(r"$\alpha$")
    ax.set_xscale("log")
    ax.set_ylim(0,X.shape[1]+1)
    ax.set_ylabel("zeros in coef")
    ax.set_title("Sparsity In Lasso")
    plt.show()
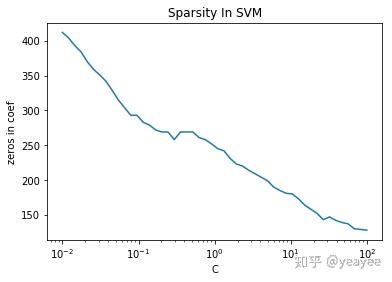
def test_LinearSVC(*data):
    '''
    测试 C  与 稀疏性的关系

    :param data: 可变参数。它是一个元组,这里要求其元素依次为:训练样本集、测试样本集、训练样本的标记、测试样本的标记
    :return: None
    '''
    X,y=data
    Cs=np.logspace(-2,2)
    zeros=[]
    for C in Cs:
        clf=LinearSVC(C=C,penalty='l1',dual=False)
        clf.fit(X,y)
         ### 计算零的个数 ###
        num=0
        for row in clf.coef_:
            for ele in row:
                if abs(ele) < 1e-5:num+=1
        zeros.append(num)
    ##### 绘图
    fig=plt.figure()
    ax=fig.add_subplot(1,1,1)
    ax.plot(Cs,zeros)
    ax.set_xlabel("C")
    ax.set_xscale("log")
    ax.set_ylabel("zeros in coef")
    ax.set_title("Sparsity In SVM")
    plt.show()
test_SelectFromModel() # 调用 test_SelectFromModel
Threshold 0.6759827221334211
Support is [ 2  3  4  5  6  9 12 13 14 18 19 20 21 22 26 27 30 33 36 38 41 42 43 44
 45 51 53 54 55 58 61]
data=load_diabetes() # 生成用于回归问题的数据集
test_Lasso(data.data,data.target) # 调用 test_Lasso

data=load_digits() # 生成用于分类问题的数据集
test_LinearSVC(data.data,data.target) # 调用 test_LinearSVC
