Python使用bokeh及folium实现地理位置信息的交互可视化
发布时间:2021-12-03
公开文章
Talk is cheap,show U the code!
1.普通版(常规地图)
import numpy as np
from bokeh.plotting import figure, show, output_notebook
from bokeh.layouts import gridplot
output_notebook()
import pandas as pd
import folium
from folium import plugins
#加载数据
df = pd.read_csv('平台总镜头.csv',encoding='gb18030')
df0 = pd.read_csv('离线镜头.csv',encoding='gb18030')
def shixiao(x):
if x in df0['国标编码'].tolist():
return 1
else:
return 0
df['失效'] = df['国标编码'].apply(shixiao)
df = df.sample(frac=0.1, replace=True, random_state=10) #1/10数据
df0 = df[df['失效']==1] # 失效 红色 稍微大一点
df4 = df[df['失效']==1] # 失效 红色 稍微大一点
df1 = df[(df['失效']==0) & (df['建设类别']=='一类点') ] # 绿色
df2 = df[(df['失效']==0) & (df['建设类别']=='二类点') ] # 蓝色
df3 = df[(df['失效']==0) & (df['建设类别']=='三类点') ] # 青色
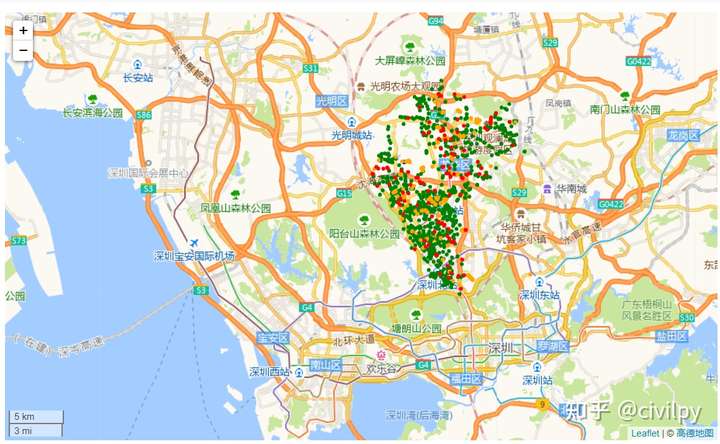
plotmap1 = folium.Map(location=[22.734057,114.058937], zoom_start=12,control_scale = True,
tiles='http://webrd02.is.autonavi.com/appmaptile?lang=zh_cn&size=1&scale=1&style=8&x={x}&y={y}&z={z}',
attr='© <a href="http://ditu.amap.com/">高德地图</a>'
)
for i in range(df1.shape[0]):
folium.Circle([df1['GPS纬度'].tolist()[i],df1['GPS经度'].tolist()[i]],color='green',radius=1).add_to(plotmap1)
for i in range(df2.shape[0]):
folium.Circle([df2['GPS纬度'].tolist()[i],df2['GPS经度'].tolist()[i]],color='blue',radius=1).add_to(plotmap1)
for i in range(df3.shape[0]):
folium.Circle([df3['GPS纬度'].tolist()[i],df3['GPS经度'].tolist()[i]],color='orange',radius=1).add_to(plotmap1)
for i in range(df0.shape[0]):
folium.Circle([df0['GPS纬度'].tolist()[i],df0['GPS经度'].tolist()[i]],color='red',radius=1).add_to(plotmap1)
plotmap1.save('folium_map_1_10_全部Bokeh.html')
import math
def lonLat2WebMercator(lon,Lat):
x = lon *20037508.34/180;
y = math.log(math.tan((90+Lat)*math.pi/360))/(math.pi/180)
y = y *20037508.34/180;
return x,y
def lonLat2WebMercator_Lon(lon): #GPS经度
x = lon *20037508.34/180
return x
def lonLat2WebMercator_Lat(Lat): # GPS纬度
y = math.log(math.tan((90+Lat)*math.pi/360))/(math.pi/180)
y = y *20037508.34/180
return y
df_new = df[(df["GPS纬度"]>22) & (df["GPS纬度"] <23) & (df["GPS经度"]>113) & (df["GPS经度"] <115)] # 有效数据
df_new["Lon"] = df_new["GPS经度"].apply(lonLat2WebMercator_Lon)
df_new["Lat"] = df_new["GPS纬度"].apply(lonLat2WebMercator_Lat)
df = df_new.copy()
df0 = df[df['失效']==1] # 失效 红色 稍微大一点
df1 = df[(df['失效']==0) & (df['建设类别']=='一类点') ] # 绿色
df2 = df[(df['失效']==0) & (df['建设类别']=='二类点') ] # 蓝色
df3 = df[(df['失效']==0) & (df['建设类别']=='三类点') ] # 青色
from bokeh.util.browser import view
from bokeh.document import Document
from bokeh.embed import file_html
from bokeh.resources import INLINE
from bokeh.models import Plot
from bokeh.models import Range1d
from bokeh.models import WheelZoomTool, PanTool, BoxZoomTool
from bokeh.models import WMTSTileSource
# 设置x,y轴的经纬度范围
x_range = Range1d(int(df_new["Lon"].min()),int(df_new["Lon"].max()))
y_range = Range1d(int(df_new["Lat"].min()),int(df_new["Lat"].max()))
tile_options = {}
# https://www.jb51.net/article/206540.htm
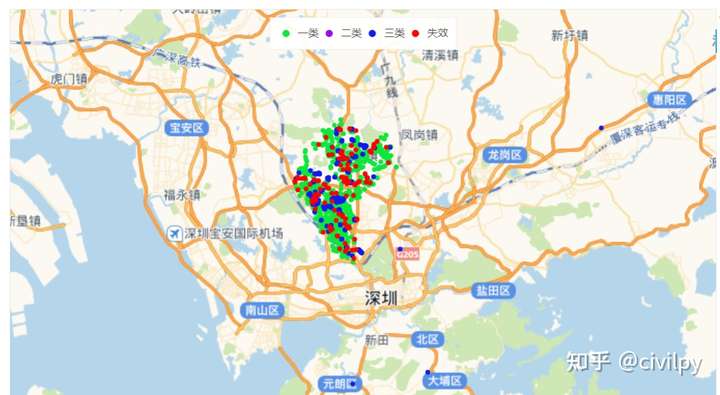
tile_options['url'] = 'http://webrd02.is.autonavi.com/appmaptile?lang=zh_cn&size=1&scale=1&style=7&x={x}&y={y}&z={z}' # style=7,8
tile_options['attribution'] = """
'© <a href="http://ditu.amap.com/">公众号:注册土木</a>.
""" # 地图右下角标签
tile_source = WMTSTileSource(**tile_options)
# 实例化plot
p = figure(x_range=x_range, y_range=y_range, plot_height=800, plot_width=1000)
# 标记区域
p.scatter(df1['Lon'], df1['Lat'],size=5, marker="circle", color="#0DE63C", alpha=0.99,legend_label='一类')
p.scatter(df2['Lon'], df2['Lat'],size=5, marker="circle", color="#9C09EB", alpha=0.99,legend_label='二类')
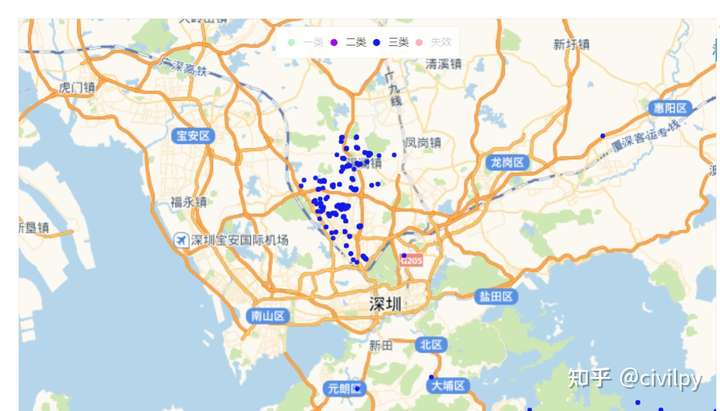
p.scatter(df3['Lon'], df3['Lat'],size=5, marker="circle", color="#101AEB", alpha=0.99,legend_label='三类')
p.scatter(df0['Lon'], df0['Lat'],size=5, marker="circle", color="red", alpha=0.99,legend_label='失效')
# 渲染地图
# p.add_tools(BoxZoomTool(match_aspect=True)) # WheelZoomTool(), PanTool(),
tile_renderer_options = {}
p.add_tile(tile_source, **tile_renderer_options)
# 其他参数
p.xaxis.visible = False
p.yaxis.visible = False
p.xgrid.grid_line_color = None
p.ygrid.grid_line_color = None
p.legend.orientation = "horizontal"
p.legend.location = "top_center"
p.legend.click_policy="hide" # 点击图例显示、隐藏图形
p.sizing_mode = 'scale_width'
# 显示
show(p)
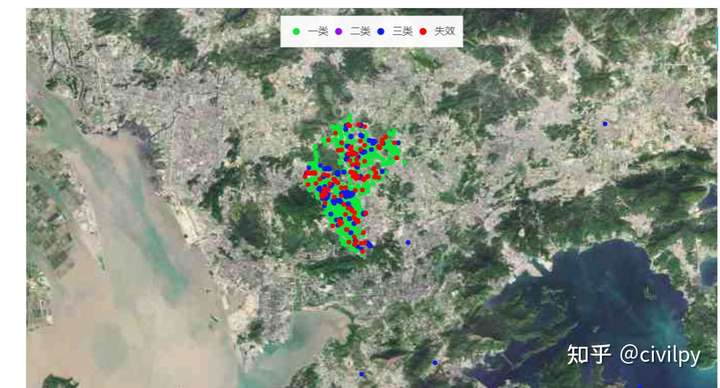
3.加强版(卫星地图)
from bokeh.util.browser import view
from bokeh.document import Document
from bokeh.embed import file_html
from bokeh.resources import INLINE
from bokeh.models import Plot
from bokeh.models import Range1d
from bokeh.models import WheelZoomTool, PanTool, BoxZoomTool
from bokeh.models import WMTSTileSource
# 设置x,y轴的经纬度范围
x_range = Range1d(int(df_new["Lon"].min()),int(df_new["Lon"].max()))
y_range = Range1d(int(df_new["Lat"].min()),int(df_new["Lat"].max()))
tile_options = {}
# https://www.jb51.net/article/206540.htm
# tile_options['url'] = 'http://webrd02.is.autonavi.com/appmaptile?lang=zh_cn&size=1&scale=1&style=7&x={x}&y={y}&z={z}' # style=7,8
tile_options['url'] = 'http://webst02.is.autonavi.com/appmaptile?style=6&x={x}&y={y}&z={z}'
# tiles='http://webst02.is.autonavi.com/appmaptile?style=6&x={x}&y={y}&z={z}', # 高德卫星图
tile_options['attribution'] = """
'© <a href="http://ditu.amap.com/">公众号:注册土木</a>.
""" # 地图右下角标签
tile_source = WMTSTileSource(**tile_options)
# 实例化plot
p = figure(x_range=x_range, y_range=y_range, plot_height=800, plot_width=1000)
# 标记区域
p.scatter(df1['Lon'], df1['Lat'],size=5, marker="circle", color="#0DE63C", alpha=0.99,legend_label='一类')
p.scatter(df2['Lon'], df2['Lat'],size=5, marker="circle", color="#9C09EB", alpha=0.99,legend_label='二类')
p.scatter(df3['Lon'], df3['Lat'],size=5, marker="circle", color="#101AEB", alpha=0.99,legend_label='三类')
p.scatter(df0['Lon'], df0['Lat'],size=5, marker="circle", color="red", alpha=0.99,legend_label='失效')
# 渲染地图
p.add_tools(WheelZoomTool(), PanTool(), BoxZoomTool(match_aspect=True)) #
tile_renderer_options = {}
p.add_tile(tile_source, **tile_renderer_options)
# 其他参数
p.xaxis.visible = False
p.yaxis.visible = False
p.xgrid.grid_line_color = None
p.ygrid.grid_line_color = None
p.legend.orientation = "horizontal"
p.legend.location = "top_center"
p.legend.click_policy="hide" # 点击图例显示、隐藏图形
p.sizing_mode = 'scale_width'
# 显示
show(p)